A sample sales analysis of a fictional stationery shop. Twelve months, three product categories, and a question that revenue alone cannot answer.
Neeraj T
Sales grew. Did the business improve?
Sample project · Fictional data
This demonstration uses constructed data for January–December 2026. It is a practice case, not a client engagement.
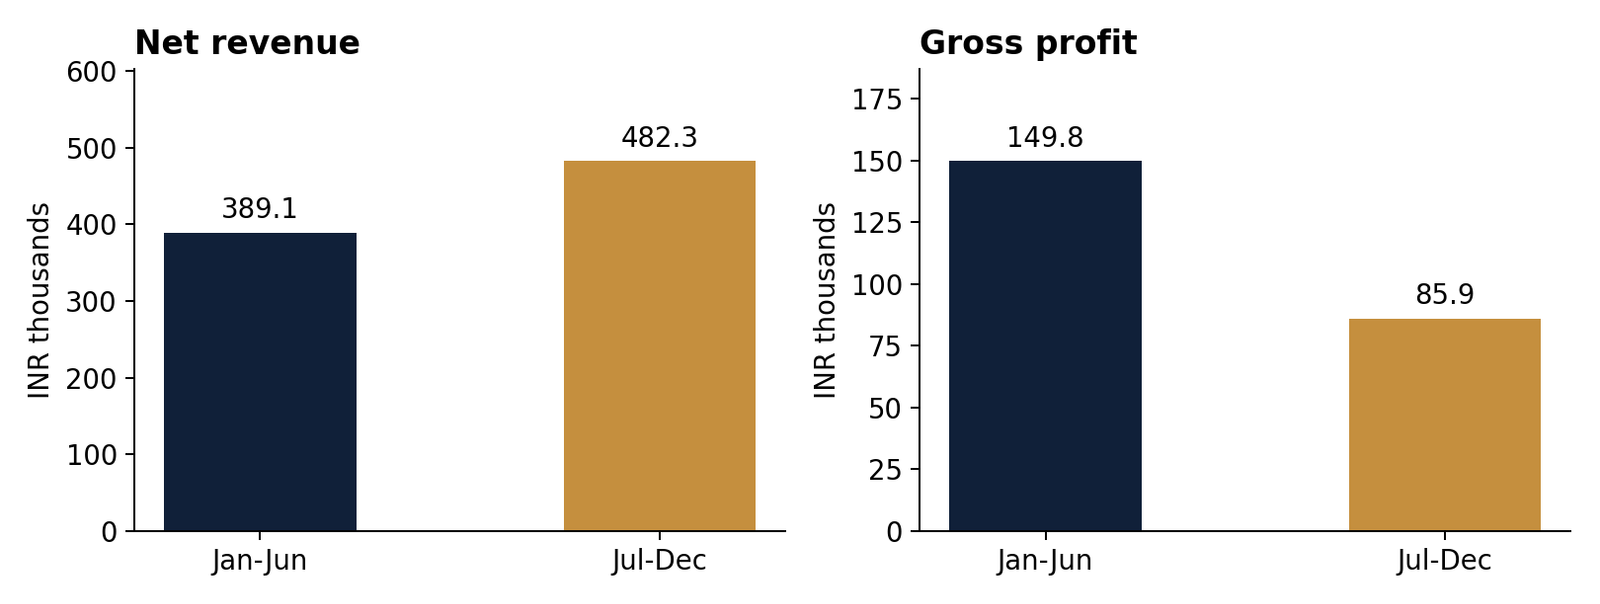
NET REVENUE+24.0%₹3,89,120 → ₹4,82,330
GROSS PROFIT−42.6%₹1,49,760 → ₹85,900
GROSS MARGIN17.8%Down from 38.5%
Comparison: July–December versus January–June. Gross profit excludes operating expenses and is not net profit.
More sales. Less gross profit.
Higher sales volumes did not offset the lower profit per unit. Larger discounts reduced margins in all three categories. Accessories reached zero gross profit: a ₹300 item discounted by 30% sold for ₹210, exactly its product cost.
What would I investigate next?
- Review accessory discounts first: the current price covers product cost, leaving nothing for operating expenses.
- Track revenue, gross profit and gross margin together, by category.
- Test a narrower promotion with a comparison group and measure profit after returns and campaign costs.
- Add order-level data, customer repeat purchases and fulfilment costs before making a commercial decision.
From question to evidence.
The dataset has 36 rows: 12 months × 3 categories. Every row represents a category-month summary. Calculations reconcile from units and prices to revenue, product cost and gross profit. The download includes a Python verification script and a guide to recreating the analysis in Excel.
These are proposed next steps. No real-world profit improvement or client result is claimed. Customer behaviour, returns, tax and operating costs are not modelled.